
5% Property Tax Hike for D303 Tax Payers?
will d303 tax payers be taken?

district’s calculator estimates about $646 more annually for 25 years FOR a $500,000 home
By Kane County Speaks | September 23, 2026
St. Charles School District 303, wants more of your money in their latest referendum...over at least 25 years. The district is seeking $282.5 million in bonds toward a $312.5 million facilities package, with another $30 million coming from district resources. The proposal affects properties within D303’s boundaries in Kane and DuPage counties—not every property in Kane County. [1]
Understanding the household impact requires separating three numbers: the share of the existing property-tax bill going to schools, the additional dollars attributable to the referendum, and the resulting percentage increase in the homeowner’s total bill.
D303 Already TAKES About 65% of Every Property-Tax Dollar
The City of St. Charles’ June 2026 newsletter includes a property-tax distribution chart for the 2025 levy year, payable in 2026. It shows 65.4% going to the school district, before counting the separate allocation to Elgin Community College. [2]
The Illinois Department of Revenue’s latest statewide figures, covering tax year 2024, show 58.5% of property taxes levied going to school districts (statewide, not in Illinois), with community colleges reported separately. That figure represents a share of statewide tax dollars. [3]
The D303 share is 6.9 percentage points above the statewide share, or approximately 11.8% larger in relative terms. [2, 3]
These comparisons require context. The local and statewide figures cover different reporting years, and individual D303 properties can have different percentages because their other overlapping taxing bodies differ. A larger school-district share also does not establish that a homeowner’s total tax bill is higher by that same percentage.
What the Referendum Would Add in Dollars
D303’s tax calculator provides a concrete household example: a property with a $500,000 estimated 2025 fair cash value, an $8,000 general homestead exemption, and no additional exemptions has an estimated referendum-related increase of $645.77 annually, or $53.81 monthly. [4]
That additional payment would need to be accommodated within the homeowner’s budget. The monthly and annual figures describe the same expense; presenting it monthly does not reduce the yearly obligation.
The calculator estimates the increase in D303’s bond-related taxes, not changes in every component of the property-tax bill. Actual payments can vary with assessments, exemptions, district-wide taxable-value growth and other factors. [4]
How D303’s Share Could Increase by 2%
Consider an illustrative $500,000 home with a current annual property-tax bill of $12,000. Assume D303 currently receives 65.4% of that bill.
The $12,000 bill is an assumption for this example—not a reported district average.
Holding all other taxes constant and adding the district calculator’s
$645.77 estimate produces the following calculation. The starting school-tax share and estimated additional tax come from the City’s chart and D303’s calculator. [2, 4]
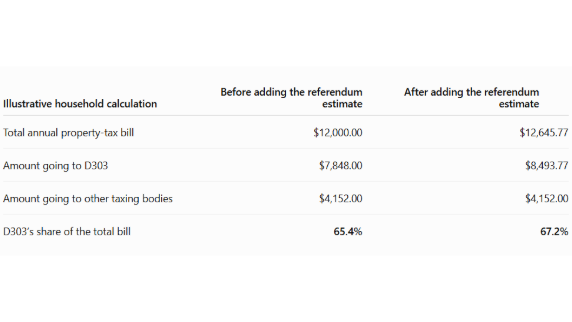
In this example, D303’s share rises by approximately 1.8 percentage points—nearly another two points. But the homeowner’s total property-tax bill rises approximately 5.4%.
Those figures measure different things. The first describes how the larger bill is divided. The second describes how much more the homeowner pays.
This is not a district-wide prediction that every property’s school-tax share will rise by exactly 1.8 points. A different starting bill, school-tax share or referendum assessment produces a different result.
What the National Comparison Actually Shows
National education-finance data provide additional context, but they must not be confused with the allocation of a property-tax bill.
For the 2022–23 school year, National Center for Education Statistics data show that property taxes supplied 44.4% of total public-school revenue in Illinois, compared with 33.2% nationally. That is an 11.2-percentage-point difference in school-funding reliance on property taxes. [5]
It does not mean that D303 receives 11% more of a homeowner’s property-tax bill than the national average. Nor does it establish that an individual D303 homeowner pays 11% more in total taxes.
The distinction is straightforward: one measurement describes where property-tax dollars go; the other describes where schools obtain their funding. They cannot be substituted for one another.
A Long-Term Obligation, Alongside a Facilities Investment
The district’s planning calls for a 25-year bond structure. The proposed work includes building-system repairs, accessibility and security improvements, expanded instructional spaces, and a physical-education and athletic facility. Those are the investments the additional borrowing would finance. [1]
For household budgeting, the financing period matters alongside the project list. The calculator’s annual estimate should not be treated as a guaranteed, unchanged payment for every year of that period. [4]
For the household illustrated above, the estimated additional tax would mean budgeting approximately $646 more annually, with D303’s share of the total bill moving from 65.4% to about 67.2%, assuming other taxes remain unchanged.
That near-two-point increase in the district’s share should not be mistaken for a tax bill that increases by only 2%. The total-bill increase in this example is approximately 5.4%.
Knowledge is POWER. Read...do your own research, share and you vote and get others to vote or you will pay A LOT over the next 25 years.
Sources and Citations
1. St. Charles Community Unit School District 303 — “Referendum.”
Official referendum information, including the November 3, 2026 ballot question, the $282.5 million bond authorization, the $312.5 million facilities package, the $30 million district contribution, proposed projects, and the planning timeline identifying a 25-year bond structure. (District 303)
2. City of St. Charles — “City News of St. Charles, Ill.—June 2026 Issue,” Property Tax Information.
Published June 1, 2026. The newsletter identifies the chart as covering the 2025 levy year, with taxes paid in 2026. Its accompanying distribution chart shows
65.4% allocated to the school district, with Elgin Community College listed separately. (GovDelivery)
3. Illinois Department of Revenue — “Table D: 2024 Extensions by District Type.”
Official statewide property-tax statistics showing
58.5% of tax extensions allocated to school districts. Community colleges are reported as a separate category. The 6.9-percentage-point difference and approximately 11.8% relative difference are calculations using this figure and the City’s 65.4% figure. (Illinois Department of Revenue)
4. St. Charles Community Unit School District 303 — “Referendum Tax Estimate Calculator.”
For a $500,000 estimated 2025 fair cash value, an $8,000 general homestead exemption and no additional exemptions, the calculator displays
$645.77 annually and
$53.81 monthly. It also explains the estimate’s limitations. The $12,000 starting bill and resulting 67.2% school-tax share in this article are an illustrative calculation, not district-wide projections. (District 303)
5. National Center for Education Statistics — Digest of Education Statistics, Table 235.20, “Revenues for Public Elementary and Secondary Schools, by Source of Funds and State or Jurisdiction: School Year 2022–23.”
Prepared March 2026. Reports property taxes as
44.4% of total public-school revenue in Illinois and
33.2% nationally. These figures measure school-funding sources, not the percentage of homeowners’ property-tax bills allocated to schools. (National Center for Education Statistics)
Latest Articles, Submissions & Community Highlights
Participating groups, neighborhood leaders, and citizen coalitions can share news, documents, or resources here.